Daily Leverage Certificates
DLC Hotline: (65) 6226 2828
The US Fed hiked interest rates by 25 basis points. BOE and ECB each hiked 50 basis points. Nasdaq 100 is up over 15% year-to-date led by Meta and Amazon. DXY erased two weeks of losses to close the week at $103 on back of better than expected Non-Farm Payrolls and ISM Services PMI.
● Japan will downgrade Covid to the same status as seasonal flu on 08 May.
● Hong Kong Securities and Futures Professionals Association has requested the HK government to dial back or cancel stock stamp duty.
● According to advance estimates by the Census and Statistics Department, Hong Kong GDP decreased 4.2% in real terms in the fourth quarter of 2022 from a year earlier.
● From 01 February, Russia bans domestic oil exports under contracts that have a price cap.
● China will drop quota limitations on personnel exchange between China, Hong Kong and Macao; tour groups will start operating from 06 February. In addition, all international arrivals to Hong Kong will no longer be required to show vaccination records from the same date.
● According to IT research firm Gartner, shipments of PCs and mobile phones are expected to fall for the second straight year in 2023.
● South Korea semiconductor sales to China slid 46.6% in January; total exports tumbled by 31.4%.
● China Caixin Services PMI rose to 52.9 in January, Manufacturing PMI at 49.2.
Hang Seng Index
closed this week at 21660, down 1028 points or 4.53%. Price action on the weekly chart shows a bearish engulfing candle lookalike. This is a candlestick pattern associated with tops. Appearing right at a resistance level also gives it additional significance. There are a few levels to note. 22665 is the low of 2021 printed in December that year. 22200 is a previous resistance based on previous swing highs printed in April and June 2022. Together both form a potential resistance zone. This zone could still be tested in the coming days as 10 and 20 Day SMAs are still advancing. 20000 is a level below to watch out for potential support. It is a psychological level and confluences with swing lows printed in March and May 2022,
50 Day SMA printed golden crosses (bottom right circle) with the 100 and 150 Day indicators which terminate previous downtrend. The 100 and 150 pair have not crossed. HSI could be going through the early stage of a bullish reversal although sharp corrections could be expected as long term moving averages are still signaling that it is likely a bear rally.
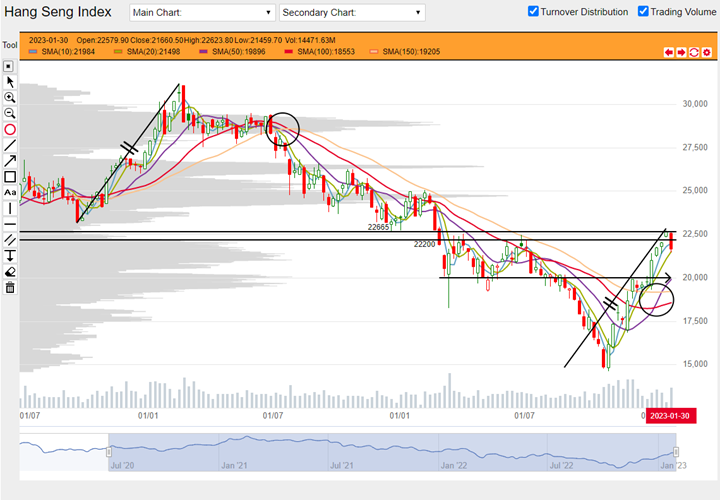
HSI weekly chart from 06 July 2020 to 03 February 2023 (Source: DLC.socgen.com)
Hang Seng Tech closed the week at 4634, down 179 points or 3.72%. 10 and 20 Day SMAs are still advancing so it is possible to see gains in the HSTech next week. 5000 is a prominent level so there is a likelihood that the market would push the index to this level. 4500 could offer some support based on price action from mid-January. Lower below, 4000 would be a more attractive level to expect a base for subsequently high moves. It was previous support and long term moving averages are converging nearby.
50 and 100 Day SMA are signaling a bull trend although the 100 and 150 pair has not caught up. As long as indicator signals diverge, expect more sideways consolidation until market forces can find consensus.
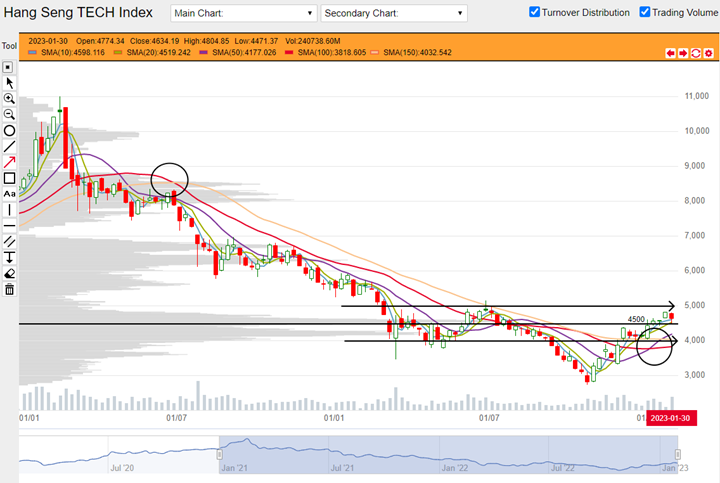
HSTech weekly chart from 04 January 2021 to 03 February 2023 (Source: DLC.socgen.com)
Dow Jones Industrial Average closed the week at 33926, down 52 points or 0.15%. Nasdaq closed the week at 12573, up 407 points or 3.34%. Year-to-date, Dow is up 779 points or 2.35% while Nasdaq outperformed with a 1634 points or 14.93% gain. Technical indicators portray a different story. Both indices are trading above their basket of moving averages so this is a setup associated with further gains. 100 and 150 Day SMAs for Dow have crossed bullishly thereby terminating its previous downtrend. On the other hand, a direct reading of the same pair of averages for Nasdaq indicates that this year’s bullish performance belongs to a bear rally. Long term indicators are slow to reflect change so investors should internalize whether this is an outdated signal for Nasdaq or showing its true picture.
The next FOMC meeting is scheduled on 22 March 2023. Fed Fund Futures are trading at 99.6% probability basis points rate hike. Going into May meeting, traders are betting on a 37.2% probability of no change and a 62.6% probability of another 25 points hike. At the moment, terminal rate is expected to be 5.5% to be reached anytime from May onwards.
Rate cut probabilities take over starting from November.
Shanghai Composite gapped up 43 points on Monday opening from last week’s closing level at 3265. By close of this week’s session, it covered the gap and is net down over just 1 point. Intraweek high this week was 3310.5, just over 2 points shy of 2021 low. The index closed above its 10 Day SMA so it is possible the index could gain further next week. Potential resistance based on previous swing levels on the weekly chart indicate 3400 could be a level to look at. 50 and 100 Day SMAs have reversed although the 100 and 150 pair still indicate downtrend. Based on previous swing levels, 3200 is a potential support followed by 3000.
The Shenzhen index also gapped by on Monday followed by retracement. It managed to gain 74 points or 0.6% over the last week. It is trading above its basket of moving averages and this is a setup associated with further gains. Previous swing highs indicate potential support around 11500. Some resistance can be expected here at 12200 followed by 12500.
Economic data in coming week:
1. Wednesday 08 February 2023 Fed Chair Powell will speak followed by FOMC member Williams.
2. Thursday 09 February 2023 BOE Governor and Monetary Policy Committee members testify in the UK Parliament.
3. Friday 10 February 2023 China reports CPI and PPI.
4. Friday 10 February 2023 UK reports month-on-month GDP.
5. Friday 10 February 2023 US reports preliminary UoM Consumer Sentiment.
Other news:
● AIA bought back shares.
● China Mobile, Galaxy Entertainment, PetroChina and SHK Properties made new 52-week highs.
● JD.com will shut down its ecommerce sites in Indonesia and Thailand.
● JPMorgan reduced its holdings in Bili Bili.
● Blackrock disclosed that it had increased its stake in Baidu.
● Berkshire Hathaway further reduced its holdings in BYD.
Technical observations
BYD 1211.hk runs into potential resistance, tug of war with high volume.
Note chart features:
1. BYD is currently rising in conjunction with its 10 and 20 Day SMAs. Based on previous swing highs, there appears to be a potential resistance zone between $264-278. This week’s price action is a Doji with long tails suggesting some struggle. This could be a nod to the existence of overhead resistance or could simply be due to negativity from the broad indices.
2. Berkshire Hathaway disclosed that it further lightened its holdings of BYD in January, an action that started in August 2022.
3. A straightforward reading of BYD’s long term moving average indicators suggest that the stock could be in a downtrend that started late last year (see circle enclosing moving average dead crosses). If so, the current price action could be a bear rally. It is also possible that BYD is confined to a slightly flat to rising channel so it is not unusual for long term indicators to weave through this channel and persistently send out late signals.
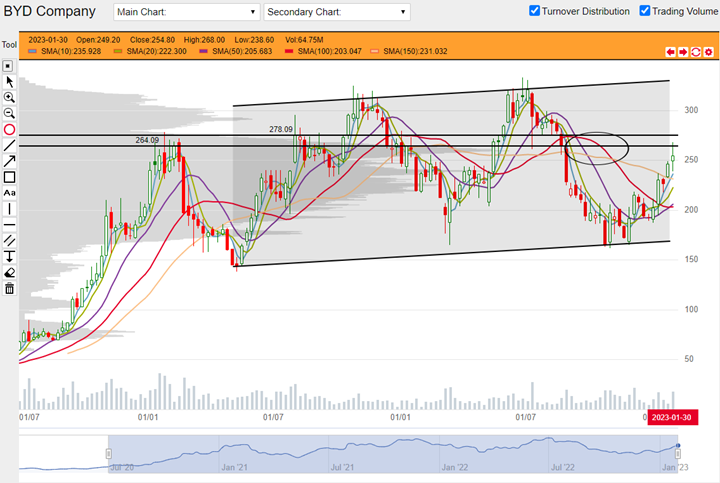
BYD 1211.hk weekly chart from 06 July 2020 to 03 February 2023 (Source: DLC.socgen.com)
Tencent 700.hk down week on high volume.
Note chart features:
1. Tencent closed a negative week on high volume. Intraweek, Monday and Tuesday 30-31 January 2023 were downdays with high volume. These could coincide with market chatter that online games fared poorly in 2022.
2. The high volume downweek coincided with a potential resistance zone between $396-426. Additionally Tencent price action appears also to track a downward channel since February 2021 and price is topping right now. These confluent signals reinforce each other and are significant to chart readers.
3. Short term moving averages are still rising so Tencent could attempt the overhead resistance again next week. Should a correction take over, a prominent potential support could be spotted at around $300. This coincides with a previous low and is also where the 100 and 150 Day SMA appear to converge.
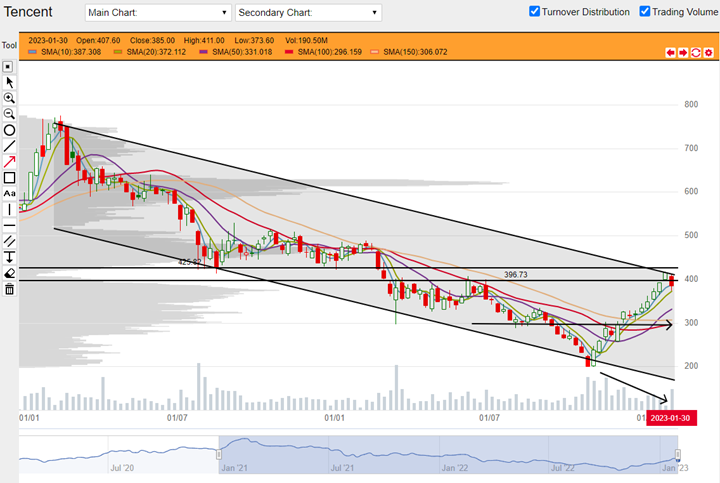
Tencent 700.hk weekly chart from 04 January 2021 to 03 February 2023 (Source: DLC.socgen.com)
Underlying Index/Stock |
Underlying Chg (%)1 |
Long DLC (Bid Change%2) |
Short DLC (Bid Change%2) |
|---|---|---|---|
| Hang Seng Index (HSI) | -1.87% | CVMW (-7.71%) | WIEW (+11.72%) |
| Hang Seng TECH Index (HSTECH) | -3.26% | UMCW (-20.83%) | YVRW (+18.00%) |
| BYD Company (1211.HK) | -4.76% | VLSW (-24.07%) | 5C3W (+27.20%) |
| Tencent (0700.HK) | -2.22% | ZS6W (-9.26%) | 9VHW (+12.87%) |
Brought to you by SG DLC Team
This advertisement has not been reviewed by the Monetary Authority of Singapore. This advertisement is distributed by Société Générale, Singapore Branch. This advertisement does not form part of any offer or invitation to buy or sell any daily leverage certificates (the “DLCs”), and nothing herein should be considered as financial advice or recommendation. The price may rise and fall in value rapidly and holders may lose all of their investment. Any past performance is not indicative of future performance. Investments in DLCs carry significant risks, please see dlc.socgen.com for further information and relevant risks. The DLCs are for specified investment products (SIP) qualified investors only.
Full Disclaimer - here